The trends tab of the Streametric app allows the user to plot data from one or multiple sites. This data can include pump information, flow information, well/tank information, and alarm information. Multiple different sets of data can be co-plotted on the same axis to allow for easy comparison.
Plotting Data #
To begin plotting data using the trends tab, first click the “Add Chart” button.

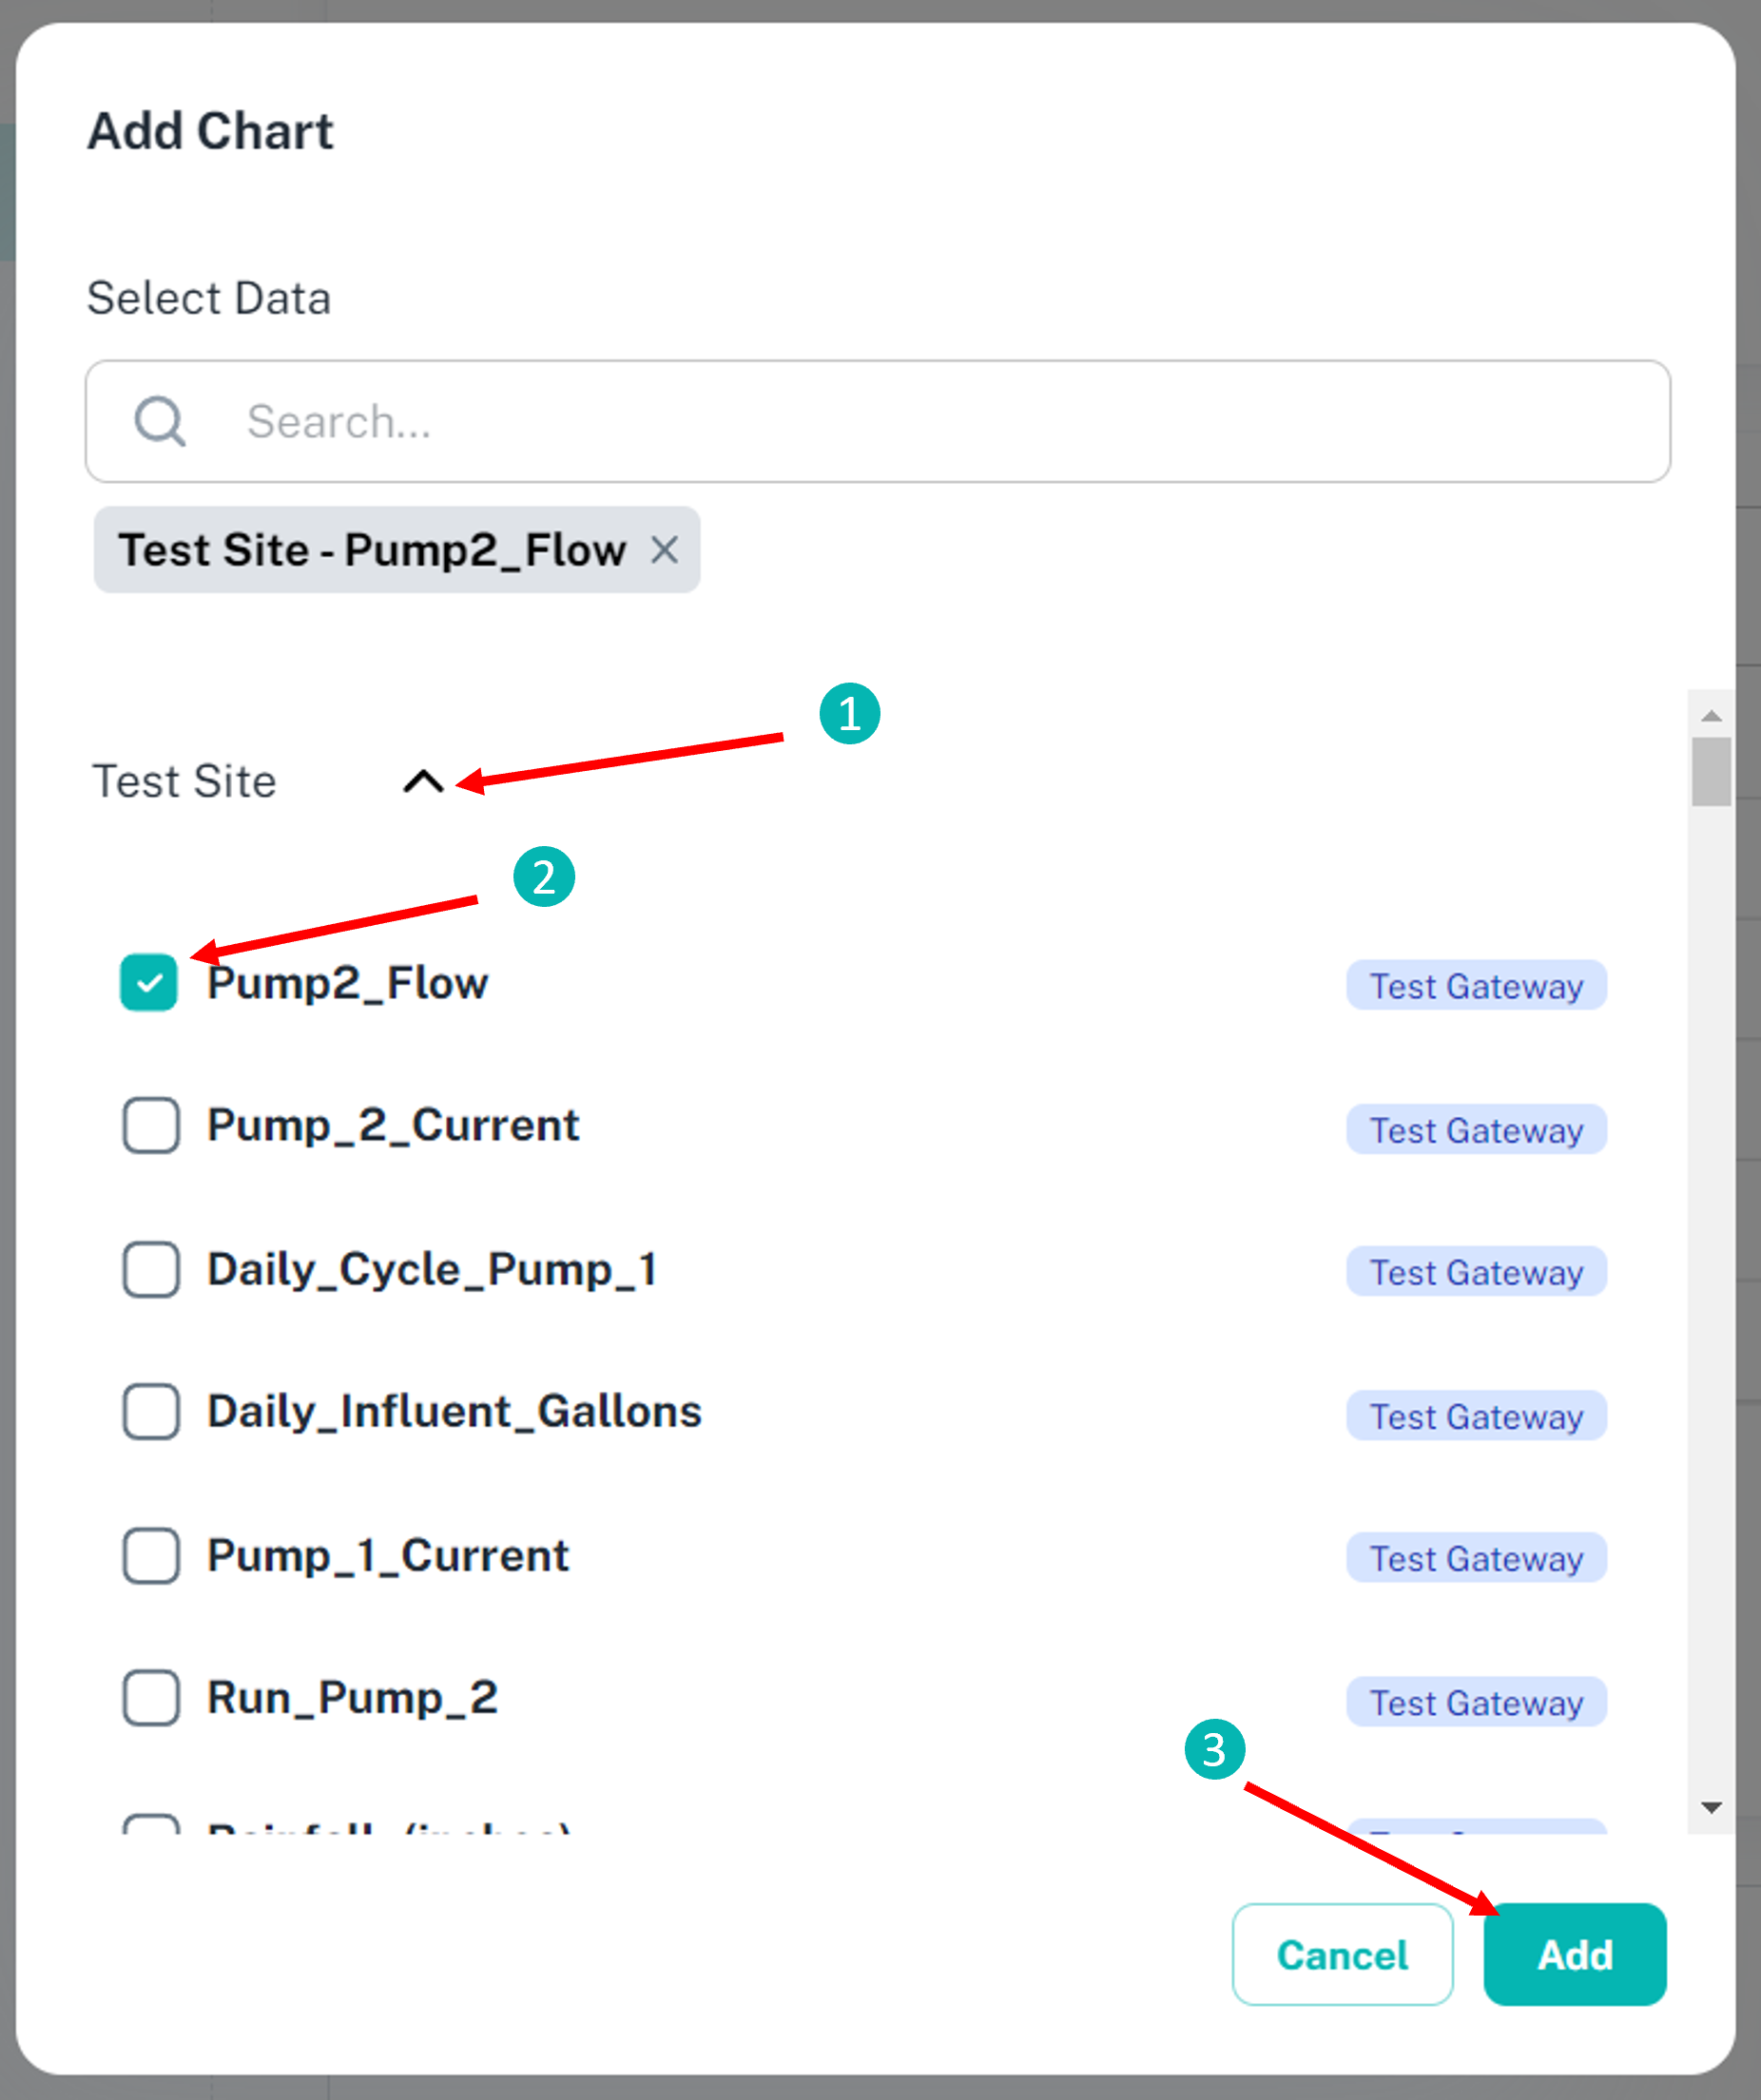
This button brings up the data selection menu. Next, select the drop-down arrow next to the site which you want to plot data for. This will show all of the data options that are available to be plotted for that site. Select the data you want to plot by clicking on the box next to the data labels. Once all of the desired data is selected, click the “Add” button. It is also possible to search for data using the “Search” feature at the top of this menu.
Selecting Date Range for Data #
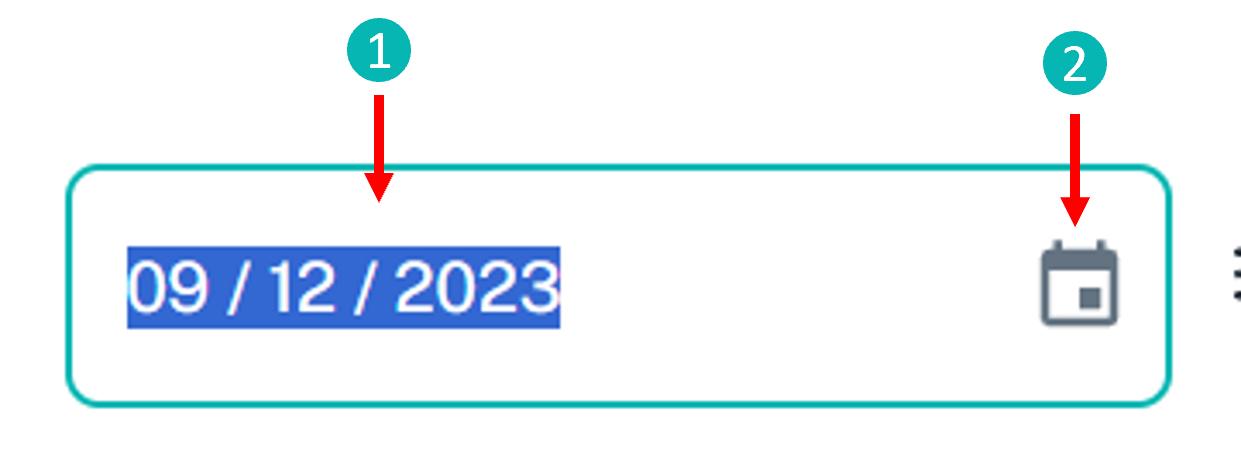
To change the date range for a plot, there are two options. The first option is to directly type the desired date into the date box. The second option is to click on the calendar icon to the right of the date. This brings up a date selection calendar in which the day or days that need to be plotted can be selected.
Modifying Chart Data #
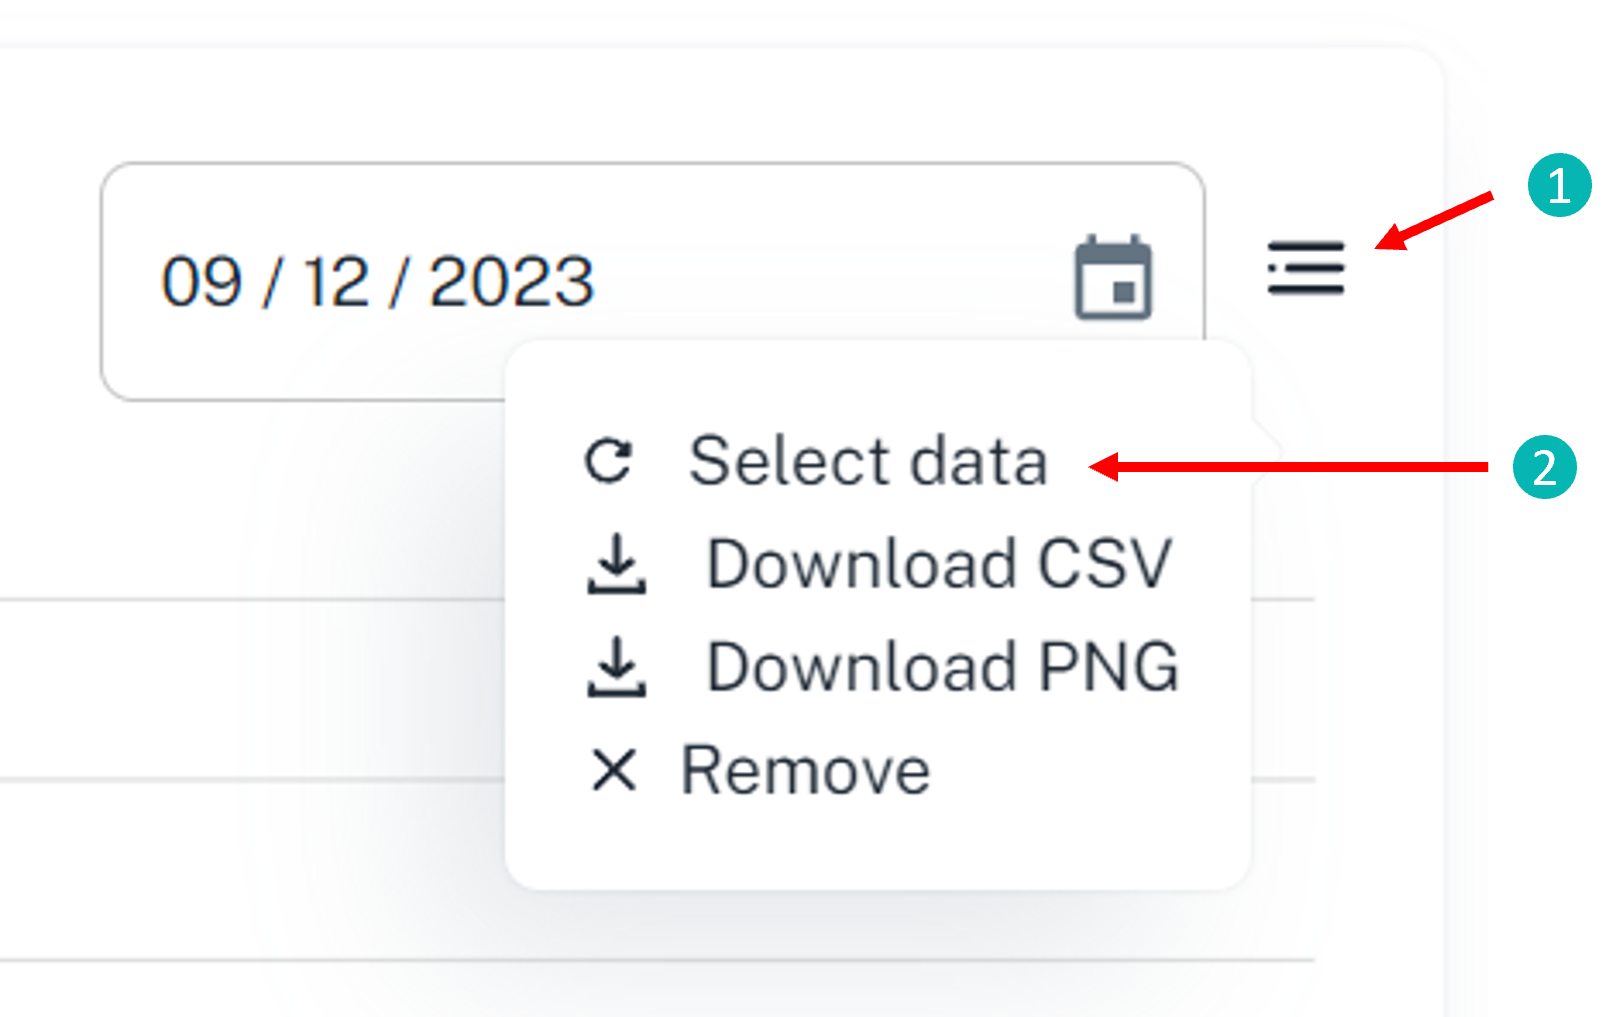
The change which data is present on a plot, select the drop-down menu button on the chart. Next, click “Select Data”. This will bring back the data selection menu.
Downloading Chart CSV Data or Chart PNG #
To download either the chart numeric data in CSV format, or to download a PNG of the chart, first select the drop-down menu. Next, select either “Download CSV” or “Download PNG”.

Removing a Chart #
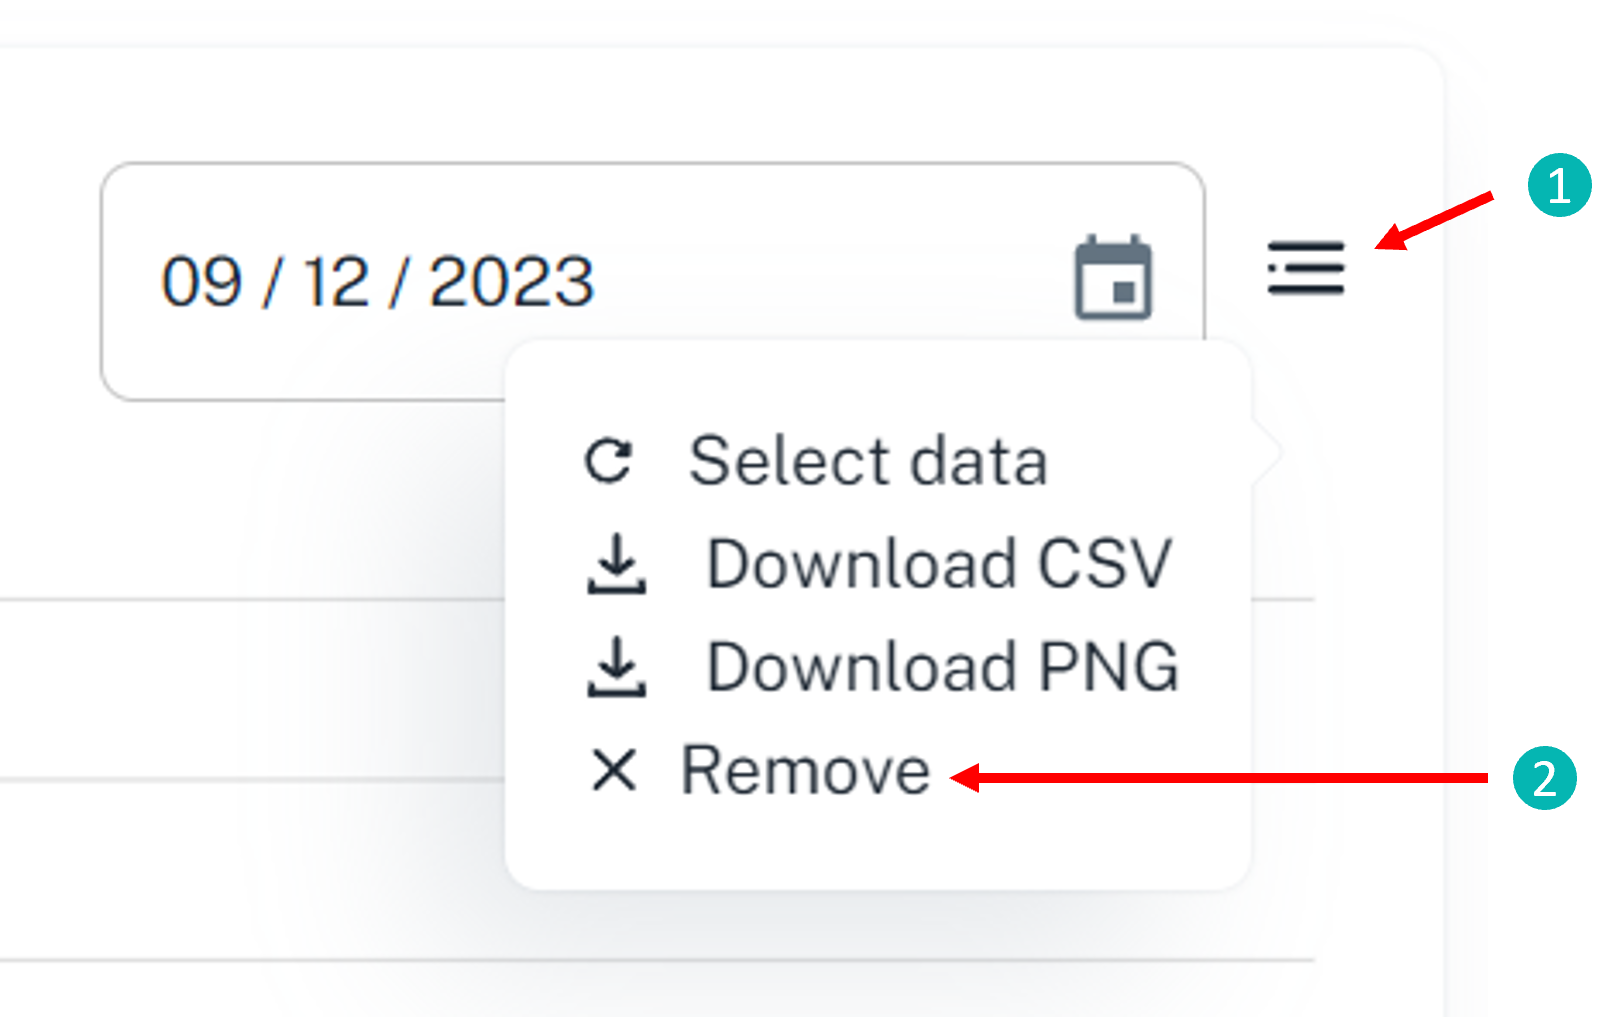
To remove a chart, first select the drop-down menu. Next, select “Remove”.